


LinkedIn reports that companies making the most skills-based searches are 12% more likely to make a quality hire. This shows why hiring data matters beyond simply tracking applications.
Hiring teams collect information at almost every recruitment stage. They know where candidates come from, how long hiring takes and how applicants perform in assessments. The challenge is turning this data into better hiring decisions.
Recruitment analytics helps teams identify slow stages, compare sourcing channels and understand candidate progression. The goal is not to track every metric. It is to use the right data to answer specific recruitment questions.
This guide explains recruitment analytics, important metrics and practical ways to use recruitment data for better hiring decisions.
TL;DR Summary
- Recruitment analytics turns hiring data into actionable insights.
- Track time to hire, cost per hire, source of hire and conversion rates.
- Funnel data helps identify bottlenecks, candidate drop-off and screening gaps.
- Recruitment dashboards make performance easier to monitor across hiring stages.
- AI can surface patterns faster, but recruiters should retain human oversight.
- Skills-based searches make companies 12% more likely to make a quality hire.
- The median time-to-fill for nonexecutive roles is 39 calendar days.
- The average cost per hire is nearly $4,700.
What Is Recruitment Analytics?
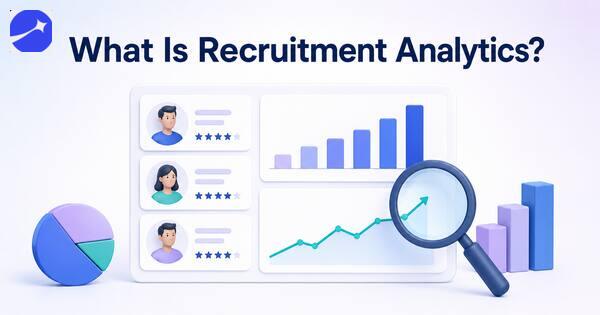
Recruitment analytics is the process of collecting and analyzing hiring data to understand recruitment performance.
It measures different parts of the candidate journey from sourcing and application to screening, interviews and hiring. Recruiters can then use these insights to identify patterns and improve their hiring process.
Consider a company receiving 1,000 applications for a technical position. Recruitment data may show that 400 candidates reach an assessment but only 100 complete it.
The completion rate tells recruiters where candidates are leaving. The next step is understanding why. The assessment may be too long or candidates may receive unclear instructions.
This is where recruitment analytics becomes useful. It turns hiring activity into measurable information that teams can investigate and improve.
Why Is Recruitment Analytics Important?
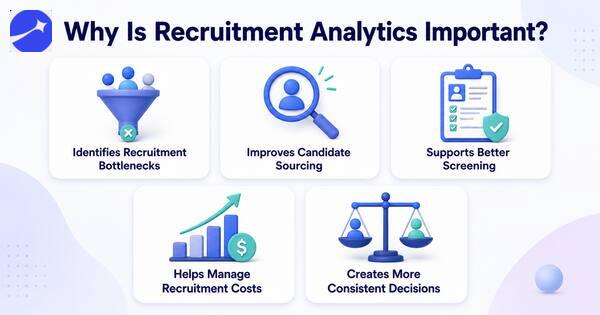
- Identifies Recruitment Bottlenecks
Recruitment analytics shows how long candidates spend at different stages.
A high time to hire may come from slow resume screening or delayed interviews. Identifying the exact stage allows recruiters to address the real problem.
- Improves Candidate Sourcing
Not every sourcing channel delivers the same results.
Recruiters can compare applications, qualified candidates, hiring assessment performance and eventual hires from job boards, referrals and other channels. This helps teams focus resources on sources that produce relevant candidates.
- Supports Better Screening
Screening data can reveal how candidates progress from applications to assessments and interviews.
A very low screening pass rate may indicate that the job advertisement is attracting unsuitable candidates. A very high pass rate may suggest that screening criteria are too broad.
- Helps Manage Recruitment Costs
Recruitment involves advertising costs, recruiter time and technology expenses.
Analytics helps companies understand what they spend to produce successful hires. Teams can then evaluate whether particular recruitment activities justify their cost.
- Creates More Consistent Decisions
Recruitment data gives hiring teams a common reference point.
Recruiters can use standardized assessment results and stage conversion data alongside interviews and other evidence. This reduces dependence on general impressions when evaluating the hiring process.
Make recruitment analytics more actionable with HyreNet’s data-backed hiring platform. Track key hiring metrics, improve candidate quality, reduce manual decision-making, identify recruitment bottlenecks, and build a smarter hiring workflow that helps teams make faster and more accurate talent decisions.
What Are the Different Types of Recruitment Analytics?
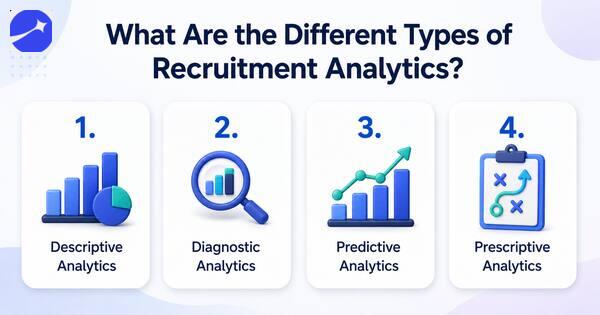
1. Descriptive Analytics
Descriptive analytics explains what has already happened.
It can answer questions such as:
- How many candidates applied?
- How long did hiring take?
- How many candidates passed the assessment?
- What percentage accepted their offers?
This creates a baseline for understanding recruitment performance.
2. Diagnostic Analytics
Diagnostic analytics examines why something happened.
Suppose assessment completion falls from 80% to 55%. Recruiters can investigate changes in assessment length, instructions or candidate communication.
This moves the analysis from identifying a problem to finding its possible cause.
3. Predictive Analytics
Predictive recruitment analytics uses historical data and statistical models to estimate possible future outcomes.
For example, organizations may analyze previous hiring patterns to estimate future recruitment demand or expected time to fill.
Predictions should support planning rather than become automatic hiring decisions about individual candidates.
4. Prescriptive Analytics
Prescriptive analytics focuses on possible actions.
Recruitment data may show that a particular sourcing channel produces qualified candidates at a lower cost. The team could then consider allocating more recruitment resources to that source.
Human judgment remains important when deciding how to act on these insights.
What Are the Most Important Recruitment Analytics Metrics?
The right recruitment metrics depend on the question a hiring team wants to answer.
Several metrics are particularly useful for understanding overall recruitment performance.
- Time to Fill
Time to fill measures how long it takes to fill an open position.
It usually begins when a job is approved or opened and ends when a candidate accepts the offer.
A long time to fill can indicate sourcing difficulties or delays within the recruitment process.
- Time to Hire
Time to hire focuses on the candidate journey.
It measures the time between a candidate entering the hiring process and accepting an offer.
Tracking this metric helps teams understand how quickly suitable candidates move through screening, assessments and interviews.
- Source of Hire
Source of hire identifies where successful candidates originated.
Sources may include:
- Employee referrals
- Career pages
- Job boards
- Social platforms
- Recruitment agencies
- Talent databases
Recruiters can compare sources based on actual hiring outcomes rather than application volume alone.
- Cost per Hire
Cost per hire measures the average recruitment cost associated with making a hire.
A simplified calculation is:
Cost per hire = Total recruitment costs ÷ Number of hires
Recruitment costs may include advertising, agency fees and recruitment technology expenses.
- Candidate Conversion Rate
Candidate conversion rate measures how many applicants progress from one recruitment stage to another.
For example:
Stage conversion rate = Candidates reaching next stage ÷ Candidates entering current stage × 100
Suppose 200 candidates complete an assessment and 50 progress to interviews. The assessment-to-interview conversion rate is 25%.
Large changes between stages can highlight areas that need closer review.
- Assessment Completion Rate
Assessment completion rate measures how many invited candidates actually finish an assessment.
A low rate may indicate that the assessment is too long or poorly communicated. Technical problems can also affect completion.
- Interview-to-Offer Ratio
This metric compares the number of candidates interviewed with the number receiving offers.
A team conducting 40 interviews to make two offers may need to examine its screening criteria.
Better early-stage screening can help recruiters spend interview time on more relevant candidates.
- Offer Acceptance Rate
Offer acceptance rate measures the percentage of employment offers candidates accept.
A declining rate can indicate issues with compensation or hiring speed. Candidate expectations may also be misaligned earlier in the recruitment process.
- Candidate Drop-Off Rate
Candidate drop-off measures how many applicants leave before completing a recruitment stage.
High drop-off during an application or assessment can become a major recruitment challenge. It may indicate that the process is too lengthy, unclear or difficult to complete.
Recruitment Analytics Metrics at a Glance
| Recruitment metric | What it tells recruiters |
| Time to fill | How long positions remain open |
| Time to hire | How quickly candidates move through hiring |
| Source of hire | Which channels produce successful hires |
| Cost per hire | Average recruitment spending per hire |
| Conversion rate | How candidates progress between stages |
| Assessment completion | How many candidates finish assigned tests |
| Interview-to-offer ratio | How effectively screening produces strong interview candidates |
| Offer acceptance rate | How often candidates accept offers |
| Candidate drop-off | Where applicants leave the hiring process |
These metrics become more useful when analyzed together rather than separately.
How Does Recruitment Analytics Work Across the Hiring Funnel?
Recruitment analytics can track performance across the entire hiring funnel.
At the sourcing stage, recruiters can compare candidate volume and source quality. During screening, they can monitor pass rates and processing time.
Assessment analytics can show completion rates and score distributions. Interview data can reveal how many candidates progress to offers.
Offer data then shows acceptance rates and hiring outcomes.
Connecting these stages gives recruiters a clearer view of the complete candidate journey.
For example, a sourcing channel may generate 500 applications but only five interviews. Another may generate 100 applications and produce 20 interviews.
The second source may provide greater value despite delivering fewer applicants.
How Can Recruitment Analytics Improve Candidate Screening?
Candidate screening generates valuable data about applicant progression.
Recruiters can analyze screening pass rates and assessment scores to understand whether their criteria are working as intended.
Suppose most applicants pass resume screening but fail the technical assessment. This could indicate that resume screening criteria do not accurately identify the required technical abilities.
Recruiters could then refine initial screening requirements or introduce a shorter skills check earlier.
Analytics therefore creates a feedback loop. Teams can measure results and adjust the process based on evidence.
What Is the Role of AI in Recruitment Analytics?
AI can help recruitment teams process larger amounts of hiring data and identify patterns that may be difficult to spot manually.
AI-powered recruitment platforms may organize candidate data or identify unusual changes in recruitment metrics. Some tools can also summarize funnel performance and highlight stages with high drop-off.
However, AI-generated insights still require interpretation.
Recruiters should understand which data the system uses and how recommendations are generated. Human oversight becomes especially important when analytics influences decisions about individual candidates.
How to Use Recruitment Analytics Effectively
Collecting more data does not automatically improve recruitment.
Teams need a structured approach.
1. Start With a Hiring Question
Define what you want to understand before selecting a metric.
A team struggling with slow hiring might focus on time to hire and stage duration. A team facing candidate drop-off may analyze application and assessment completion.
2. Track Consistent Data
Metrics become difficult to compare when teams define them differently.
Establish consistent definitions for stages such as application, screening, assessment, interview and offer.
3. Connect Data Across Recruitment Stages
Avoid evaluating metrics in isolation.
High application volume may look positive until screening data reveals that most applicants are unsuitable.
Connecting sourcing, screening and hiring outcomes creates more useful insights.
4. Build Recruitment Dashboards
A recruitment analytics dashboard can bring important metrics into one view.
Recruiters can monitor time to hire, candidate conversion and assessment completion without manually combining multiple spreadsheets.
Keep dashboards focused on metrics that support actual decisions.
5. Review Trends Over Time
A single month rarely provides enough context.
Compare recruitment performance across several hiring periods. Trends can reveal whether changes to screening, sourcing or remote hiring assessment workflows are producing sustained improvements.
6. Protect Candidate Data
Recruitment analytics relies on personal candidate information.
Organizations should establish appropriate access controls and retention policies. Teams should also understand how recruitment technology providers process and store candidate data.
Common Recruitment Analytics Mistakes to Avoid
- Tracking too many metrics: Focus on metrics connected to real recruitment goals.
- Focusing only on application volume: More applicants do not necessarily mean better candidates.
- Ignoring context: A longer time to hire may be reasonable for a highly specialized role.
- Using inconsistent definitions: Metrics lose value when different teams calculate them differently.
- Treating correlation as proof: A pattern in recruitment data does not automatically explain why something happened.
- Removing human judgment: Analytics should inform recruitment decisions rather than make every decision automatically.
Conclusion
Recruitment analytics turns hiring data into information recruiters can use to improve their processes.
Metrics such as time to hire, cost per hire and candidate conversion show what is happening across the recruitment funnel. Assessment completion and candidate drop-off can reveal where applicants encounter friction.
The strongest approach starts with a clear hiring question. Recruiters can then select relevant metrics and connect data across sourcing, screening, assessments and interviews.
Recruitment analytics is not about collecting the largest possible amount of data. It is about using the right data to make hiring processes more efficient and informed.
FAQs
What is recruitment analytics?
Recruitment analytics is the collection and analysis of hiring data to measure recruitment performance and support better hiring decisions.
What are the most important recruitment analytics metrics?
Important metrics include time to hire, time to fill, cost per hire, source of hire, candidate conversion, assessment completion and offer acceptance rate.
How does recruitment analytics improve hiring?
It helps recruiters identify bottlenecks, compare sourcing channels and understand candidate progression across different recruitment stages.
What is a recruitment analytics dashboard?
A recruitment analytics dashboard displays important hiring metrics in one place. It helps recruiters monitor recruitment performance and identify changes over time.
How is AI used in recruitment analytics?
AI can organize large amounts of recruitment data and identify patterns or changes in hiring metrics. Recruiters should review AI-generated insights and maintain human oversight over hiring decisions.